From Broker Flyer to Buy Box: A Back-of-the-Envelope Multifamily Case Study
- Himanshu Nassa
- May 12
- 5 min read

Summary of the article
This case study shows how a simple back-of-the-envelope model can turn limited listing information into a useful first-pass investment view for a multifamily deal. It is based on an actual analysis recently performed on a multifamily asset to screen the opportunity using market-only data. Using XYZ Grove Apartments as the example, the article walks from unit mix and market rents to NOI, levered returns, DSCR, debt yield, breakeven occupancy, and sensitivity analysis, while also explaining where a lightweight model is helpful and where it can mislead.
For investors screening US multifamily opportunities, the practical lesson is that a one-page model can be good enough to answer the first question that matters: is this property worth deeper underwriting? In active deal environments, back-of-the-envelope underwriting is commonly used as a speed filter before committing time to full acquisition modeling.
Case study details
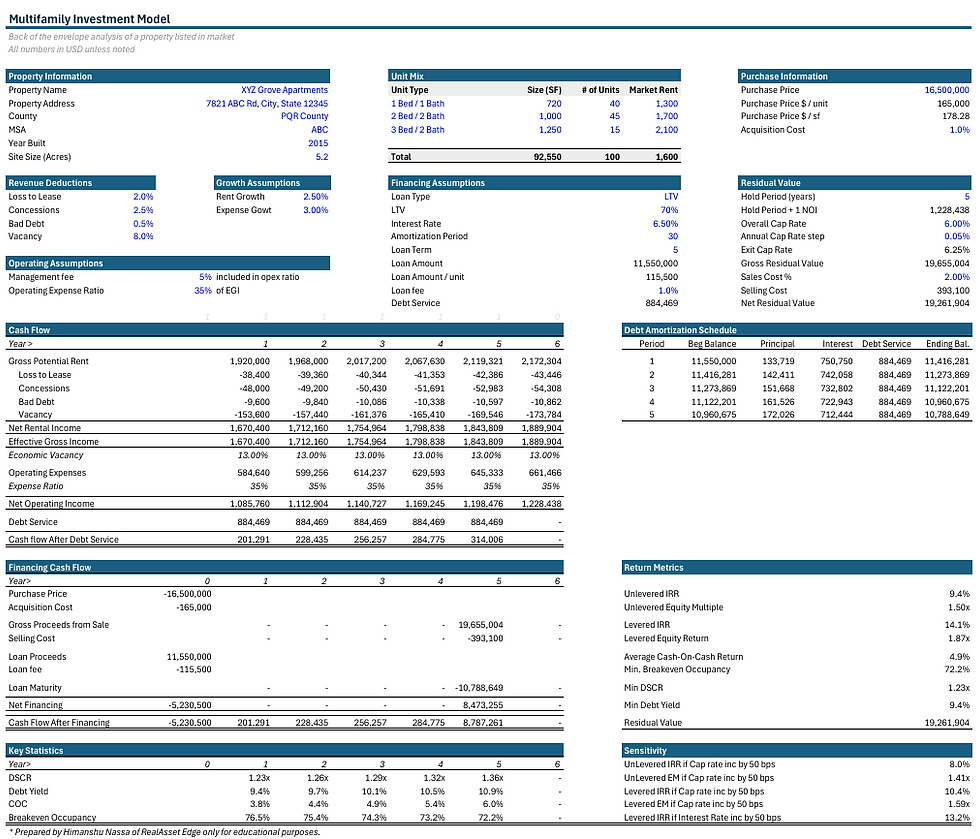
The case study centers on XYZ Grove Apartments, a 100-unit multifamily asset built in 2015 with a purchase price of $16.5 million, or $165,000 per unit. The unit mix includes 40 one-bedroom units at $1,300 market rent, 45 two-bedroom units at $1,700, and 15 three-bedroom units at $2,100, which produces annual gross potential rent of $1.92 million in Year 1.
The model assumes only market-facing operating inputs rather than property-specific trailing financials: loss to lease of 2.0 percent, concessions of 2.5 percent, bad debt of 0.5 percent, vacancy of 8.0 percent, and an operating expense ratio of 35 percent of effective gross income. On the capital side, the case uses 70 percent loan-to-value debt at 6.5 percent interest with a 30-year amortization and a 5-year hold, exiting at a 6.25 percent cap rate with 2.0 percent selling costs.
This makes the property a realistic teaching example for deals where the marketing package offers just enough information to start, but not enough to support a full institutional model. That gap between “something is listed” and “full diligence is available” is exactly where back-of-the-envelope underwriting is most useful.
Why back-of-the-envelope is required
A listed property often reaches buyers before complete rent rolls, T-12s, tax bills, repair history, or detailed capex schedules are available, so waiting for perfect data can mean losing the chance to decide quickly. A fast model creates a disciplined first screen by forcing the analyst to test whether the asking price is remotely supported by market rents, market vacancy, and normalized operating assumptions.
This matters especially in multifamily because a deal can look attractive on a broker headline cap rate but fail basic financing resilience once DSCR, debt yield, and breakeven occupancy are modeled. In other words, the back-of-the-envelope framework is not meant to replace full underwriting; it is meant to protect time, attention, and pursuit costs by identifying which deals deserve the next hour.
Steps to build the model
The first step is to convert the unit mix into gross potential rent by multiplying each unit type by its market rent and annualizing the total. In this case, the 100-unit mix supports Year 1 gross potential rent of $1,920,000 before deductions.
The second step is to apply revenue deductions that reflect market reality rather than marketing optimism. Here, the combined drag from loss to lease, concessions, bad debt, and vacancy equals 13.0 percent of gross potential rent, reducing Year 1 effective gross income to $1,670,400.
The third step is to estimate operating expenses using a simple ratio when line-item property statements are unavailable. Applying a 35 percent expense ratio produces Year 1 operating expenses of $584,640 and Year 1 NOI of $1,085,760.
The fourth step is to layer in financing and sale assumptions. The model uses a $11.55 million loan, annual debt service of $884,469, and a 5-year sale based on Year 6 NOI of $1,228,438 and a 6.25 percent exit cap rate, resulting in gross residual value of $19,655,004 and net residual value of $19,261,904 after selling costs.
The final step is to convert these operating and capital assumptions into annual equity cash flows and test both return and risk outputs. This is what transforms a rent-and-expense sketch into a decision tool.
Understanding the return metrics
The model produces an unlevered IRR of 9.4 percent and an unlevered equity multiple of 1.50x, which together indicate what the property can earn before the impact of leverage. These measures help answer whether the asset itself is priced reasonably based on stabilized cash flow growth and the expected exit value.
After debt is applied, the levered IRR increases to 14.1 percent and the levered equity multiple rises to 1.87x, with average cash-on-cash return of 4.9 percent over the hold period. That spread between unlevered and levered returns shows that debt enhances equity performance, but only because the property still generates enough operating income to service the loan comfortably.
For readers, the key learning is that return metrics should be read together, not in isolation. A mid-teens levered IRR can look attractive, but it only deserves confidence if the deal also shows durable credit metrics and does not depend on an overly aggressive exit.
Understanding the risk metrics
The model’s minimum DSCR is 1.23x, meaning NOI covers annual debt service by 23 percent in the weakest projected year. That is a passable but not oversized cushion, so the deal appears financeable but not immune to operational underperformance.
Minimum debt yield is 9.4 percent, which provides a lender-focused view of NOI relative to the outstanding loan balance and helps indicate how much income protection exists independent of interest rate structure. Breakeven occupancy starts at 76.5 percent and improves to 72.2 percent by Year 5, showing the occupancy level required to cover operating expenses and debt service.
These metrics matter because they shift the conversation from “How high is the IRR?” to “How much pain can the property absorb?” In practice, DSCR, debt yield, and breakeven occupancy often reveal risk sooner than headline return metrics do.
How sensitivity helps
Sensitivity analysis is where a simple model becomes far more valuable than a static model. In this case, increasing the exit cap rate by 50 basis points reduces unlevered IRR from 9.4 percent to 8.0 percent and levered IRR from 14.1 percent to 10.4 percent, while also compressing the equity multiples.
That result shows how strongly projected returns depend on terminal value, which is often the single most fragile assumption in a quick underwriting. The model also shows that a 50-basis-point increase in interest rate reduces levered IRR to 13.2 percent, demonstrating that financing costs matter, but the exit cap is the more powerful swing factor in this specific case.
For article readers, this section is the bridge from underwriting to judgment. A good investment memo does not just present one answer; it shows how quickly the answer changes when the assumptions become slightly less favorable.
Where this approach is not good
Back-of-the-envelope underwriting becomes less reliable when the property has unusual operating characteristics, near-term capital expenditure needs, tax reassessment risk, complex fee income, renovation plans, or material deferred maintenance that cannot be captured in a simple expense ratio. It is also weak for highly transitional deals where lease-up timing, renovation phasing, and bad-debt recovery matter more than stabilized averages.
The method can also understate market-specific cost volatility, especially in areas where insurance, payroll, utilities, or property taxes are moving faster than generic expense growth assumptions suggest. That means the model is best used as a first filter, not as the final investment committee document.
The practical takeaway from this case study is that a one-page model can be both humble and powerful. It will not tell an investor everything, but it can tell an investor whether the next stage of diligence is deserved, and that is often the most valuable answer at the listing stage.


Comments